Evaluation method of agar culture media
Time-lapse Shadow Image Analysis (TSIA) is one of agar media performance evaluation methods as well. While a media plate is being incubated, it becomes possible to draw a colony count graph or a histogram automatically, reflecting the dynamic growth support ability of agar media, unlike the traditional agar culture method that is a static visual inspection. In other words, the graph shape itself reflects the performance of agar media under evaluation.
In this TSIA usage to evaluate a performance of agar media, smaller observation ability and more frequent image sampling reflect the growth support of agar media to the graph shape more precisely. To obtain a good graph for evaluation, the concentration of standard species sample should be more than a few hundreds or closer to 1,000. When sample of thin concentration is used, the graph becomes incomplete.
Performing Agar Media Evaluation
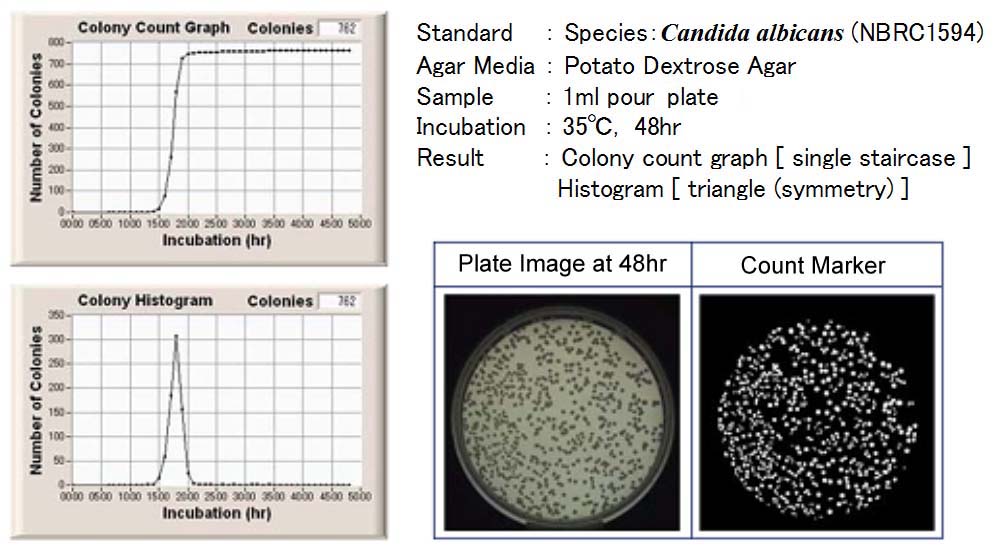
- Using MicroBio µ3D AutoScanner, obtain a colony count graph and a histogram for a sample of standard species. The concentration of sample should be more than a few hundreds or preferably about 1,000.
- A good shape that reflects good agar media performance is single stair shape for colony count graph and bell-shape (or symmetry triangle shape) for histogram, respectively.
- Obtain colony count by MicroBio µ3D AutoScanner, using standard count media for the same sample as a reference at the same time.
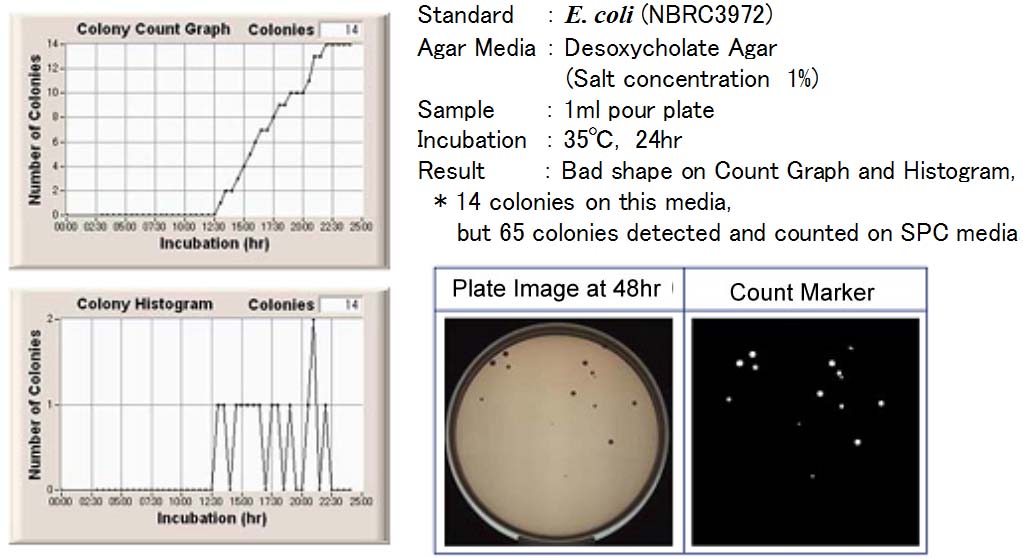
Agar media performance evaluation : Bad Example
Salt concentration of Desoxycholate agar media was raised up to 1% and the performance of it was evaluated by MicroBio µ3D AutoScanner. 14 colonies were detected and counted at 24h. The graph data were collected for the same sample and the colony count result was 65 colonies. The result shows that when salt concentration of Desoxycholate agar media is raised up 1%, the growth support ability of the species is degraded down to 20%, de-forming the graph shape as follows.
Related Page
- Time-lapse
Shadow Image Analysis (TSIA) - Time-lapse Shadow Image Analysis automates agar culture method, time-lapse monitoring media in a microscopic level for faster real time detection.