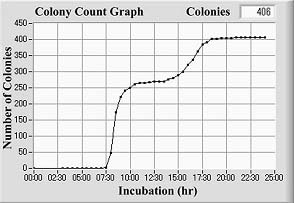
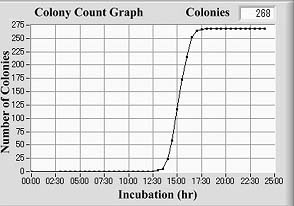
Colony count graph beomes stair case for 2 species mixed sample !


Set plates and start a test !
(Colony count graph is obtained for microbes automatically.)
For detection time bands are different for two kinds of species, a colony count graph becomes staircase.
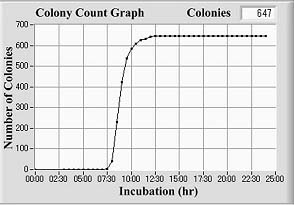
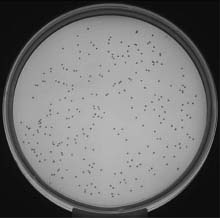
E. coli sample of single species
C. albicans sample of single species
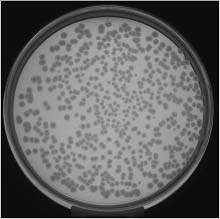
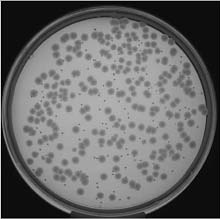
E. coli and C. albicans sample of two mixed species
Related Page
- [Wide Colony Count Range]
Range of automated colony count is from 1 to about 10 thousand. - MicroBio µ3D has a wide count range and counts from 1 colony to closer to 10 thousands.
- [Rapid Detection and Count]
They are the results that show how MicroBio µ3D system detect and counts micro-colonies rapidly and automatically. - These are the performance results of automated rapid detection and count of MicroBio µ3D on E. coli, Aspergillus brasiliensis and Candida albicans. Detection is in real time.
- [Colony Count Unit]
A cluster of touched colonies is counted correctly as separated colonies. - CFU (Colony Forming Unit) has been used for counting microbial colonies as the unit. Using MicroBio µ3D system, the exact number can be used for counting colonies.
- [Invisible colonies detected]
Colonies under a piece of hamburger is detected. - MicroBio µ3D detects invisible colonies under a piece ot hamburger. The colonies become visible after a prolonged incubation, coming out from the rim of a meat piece.
- [Pricise Colony Count]
There are 4 colonies detected among a few hundred of hamburger fragments. - There are 4 E. coli colonies detected and counted precisely among a few hundred hamburger fragments in a poured cliform detection agar plate.